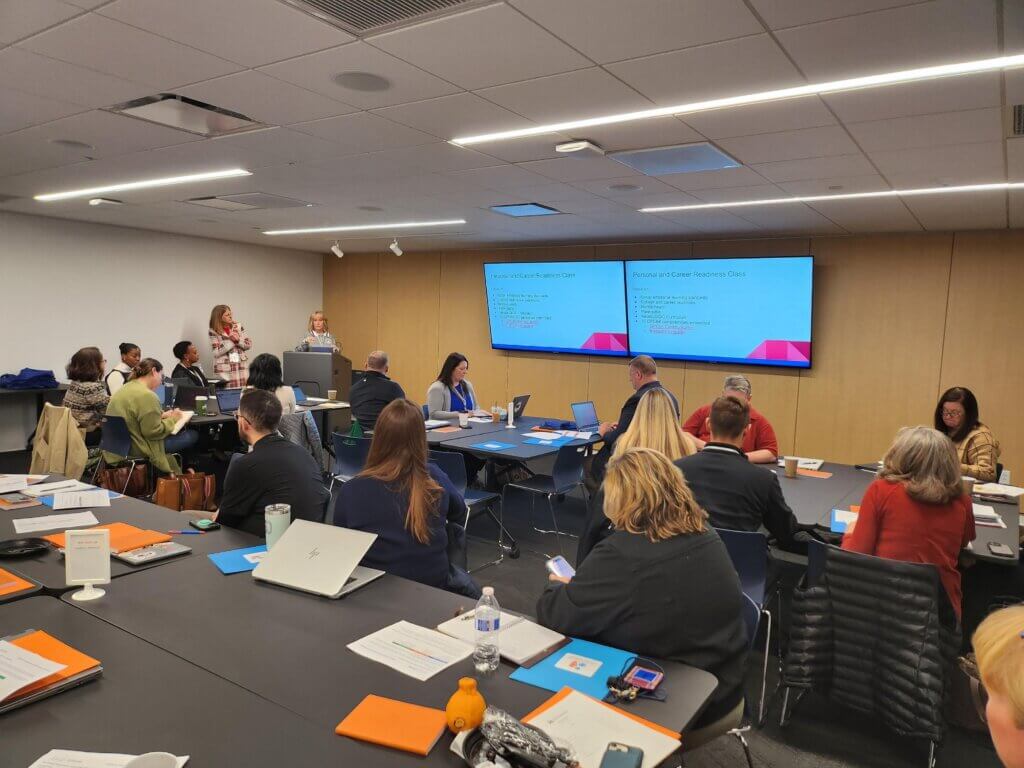
This spring and summer, representatives from the Illinois Education and Career Success Network Leadership Communities gathered to discuss how they use data to inform their work, engage with recent data to assess progress toward shared goals, and plan for future collective action. The regional meetings, bolstered by insights from the Success Network Dashboard, offer an opportunity for attendees to share strategies for advancing equitable outcomes for students as they transition from high school into life after high school.
Communities reviewed the updated dashboard, which now includes data on Career and Technical Education (CTE) participation by EFE Region, and discussed how the different dashboard views help them monitor their shared goals.
The following are some insights the communities shared on how the dashboard supports their work:
Collaborating on Solutions and Uncovering Inequities
Data provides a common language for dialogue, enabling stakeholders to develop targeted interventions and innovative solutions to common challenges. For example, in one region, the community college is collaborating with its school district partners to review data from both the college’s data warehouse and the Success Network Dashboard to identify successes and areas for improvement in students’ access to dual credit courses across the region. The review has revealed that dual credit opportunities are unevenly distributed in the region, highlighting a need to consider reimbursing or partially reimbursing teachers for graduate courses
Visualizing Progress
The dashboard provides clear and concise visualizations of key metrics, allowing Leadership Communities to monitor their performance and compare it to that of other districts within their regions. This data-driven approach fosters accountability and encourages continuous improvement. A superintendent observed that, in his region, more students in rural high school districts are taking CTE courses compared to those from other regions. He plans to present this data at the superintendents’ monthly meetings, where they can discuss how to ensure all students are aware of the available CTE courses and how these courses can benefit them.
Identify Areas for Improvement
By analyzing data on graduation rates, post-secondary enrollment, CTE participation, and other key indicators, communities can pinpoint specific areas that need attention and allocate resources effectively. A leader with an economic development council noted that they use the dashboard data to help counties in their region review the information and identify areas for improvement, which they then present to local employers and community leaders.
Share Best Practices
The dashboard helps Leadership Communities identify high-performing regions, enabling them to learn from each other’s successes and adapt proven strategies to their own contexts. A leader from a school district noted that the data helps them stay more informed about what is happening in different districts within their region, so they know who to learn from in their region.
Prioritize Student Feedback
At the June regional meeting, Success Network Student Advisory Council alumni and former youth apprentice at EdSystems Massillon Boyd shared his qualitative data research on what students need as they transition from high school to college and the workforce. He urged participants to seek out student voices to inform their work, with his project as an example of how to gather such student voices. His research serves as a reminder that while the dashboard highlights where gaps exist, student feedback can help explain why they exist and what solutions might be most meaningful. Leadership Communities were encouraged to consider how student perspectives could be incorporated into data analysis and planning, ensuring that their work remains grounded in the realities of those they aim to support. (Learn more about his research project in his article.)
Moving Forward
Reviewing data at the regional meetings fosters collaboration, promotes data-driven decision-making, and enables communities to share best practices in support of students. As Network Organizers continue to refine the dashboard, we would love to hear how you’re using it to inform your work or suggestions on how to enhance it. Please share your feedback using the feedback form at the bottom of each page view.


